
Survey performed and report generated using Ekahau Site Survey.
| General Information | ||
|---|---|---|
| Report date | 10.3.2007 11:50 | |
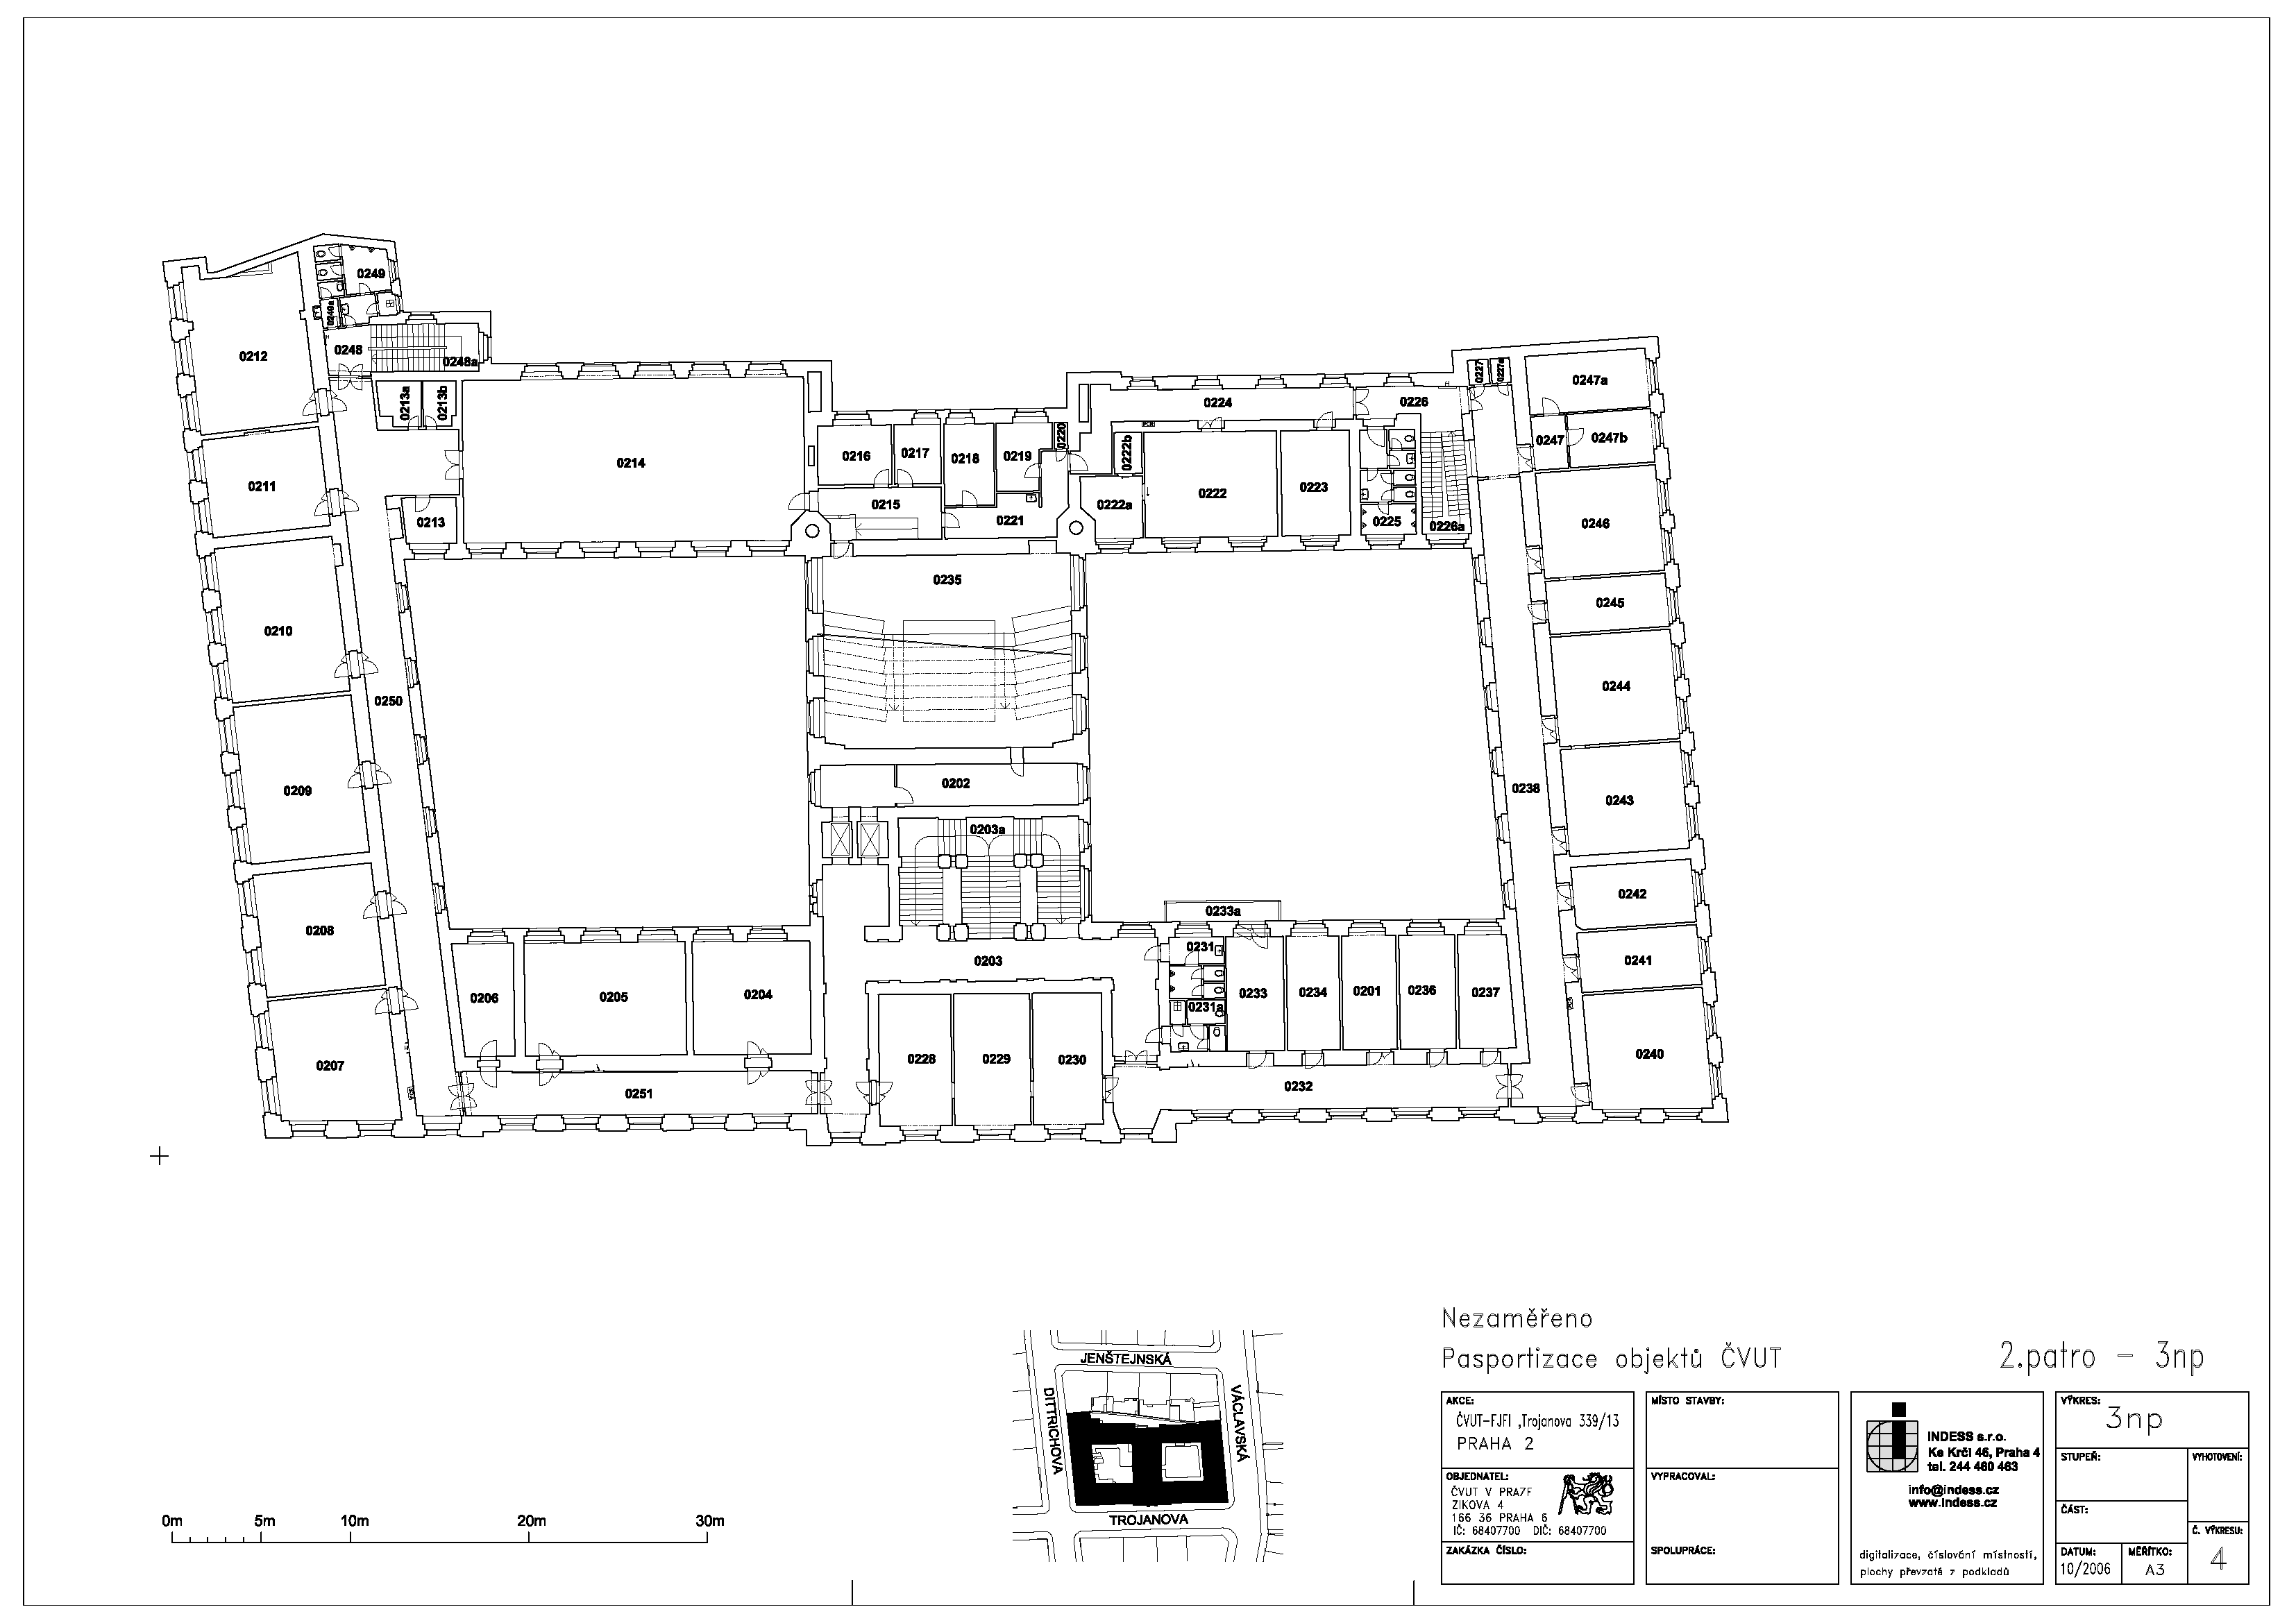
| Map: | Trojanova, 2. patro - 3np | |
| Surveys Selected | 0 out of 0 | |
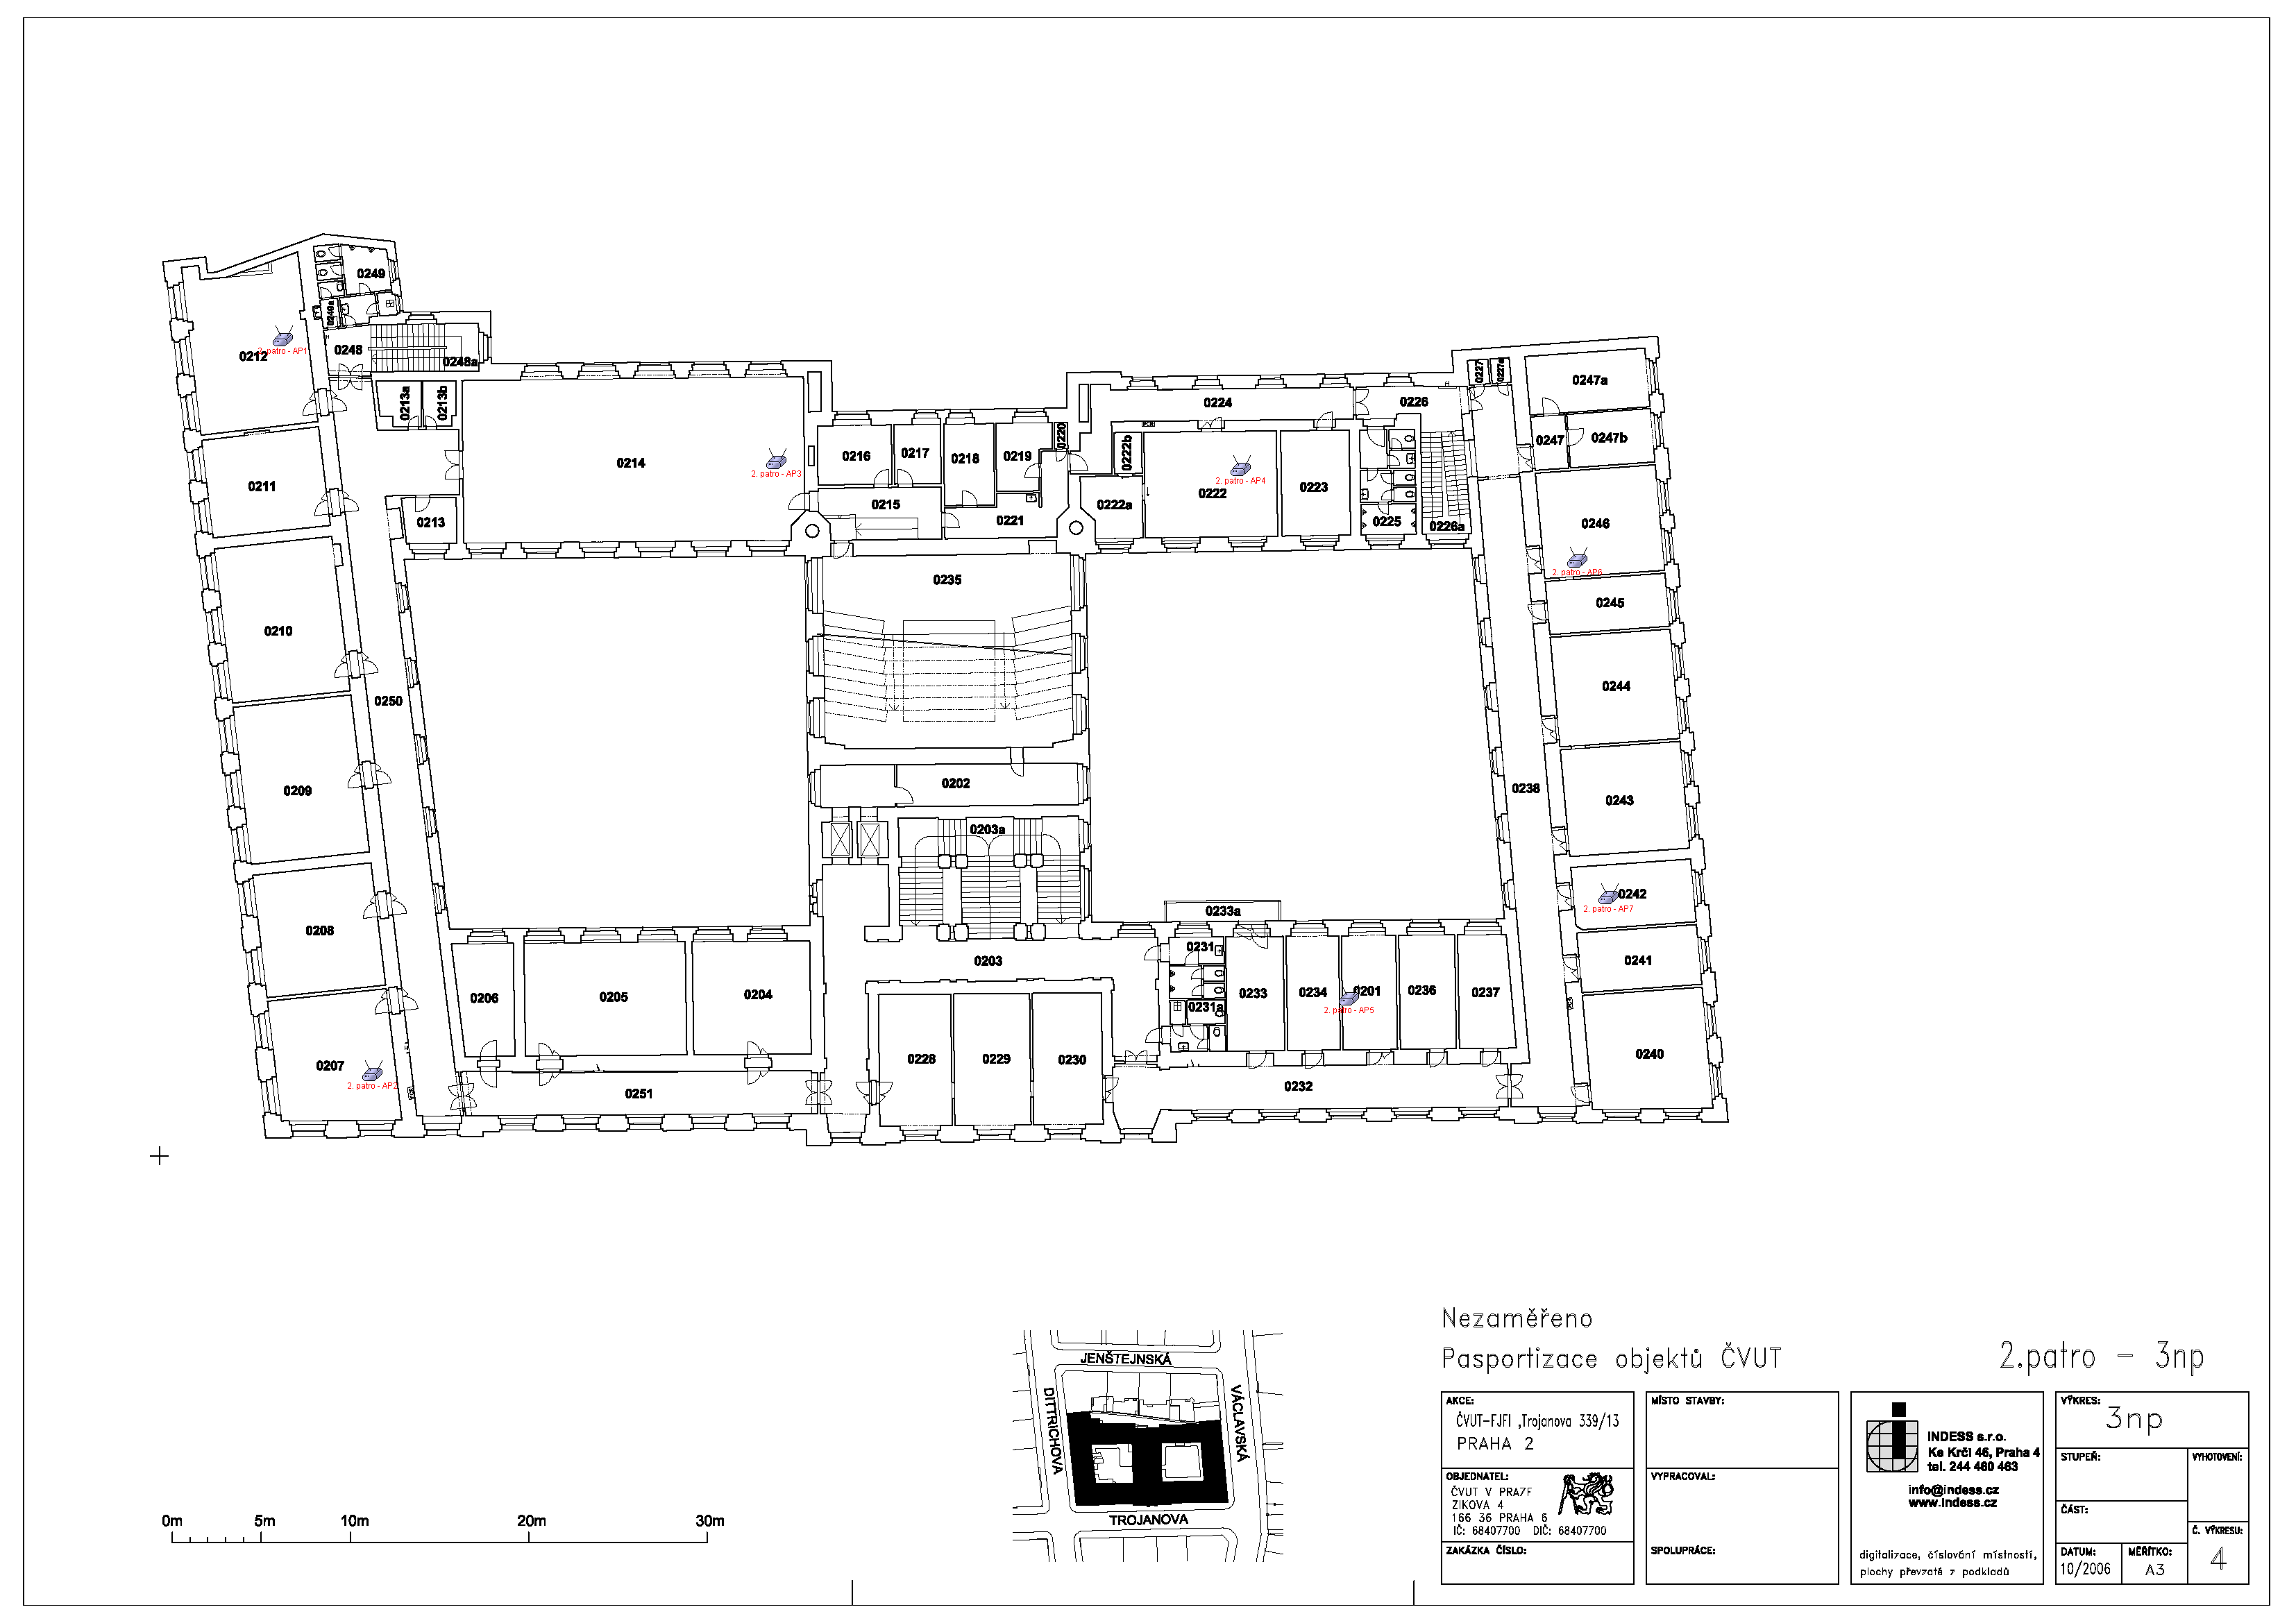
| Access Points Selected | 7 out of 31 | |
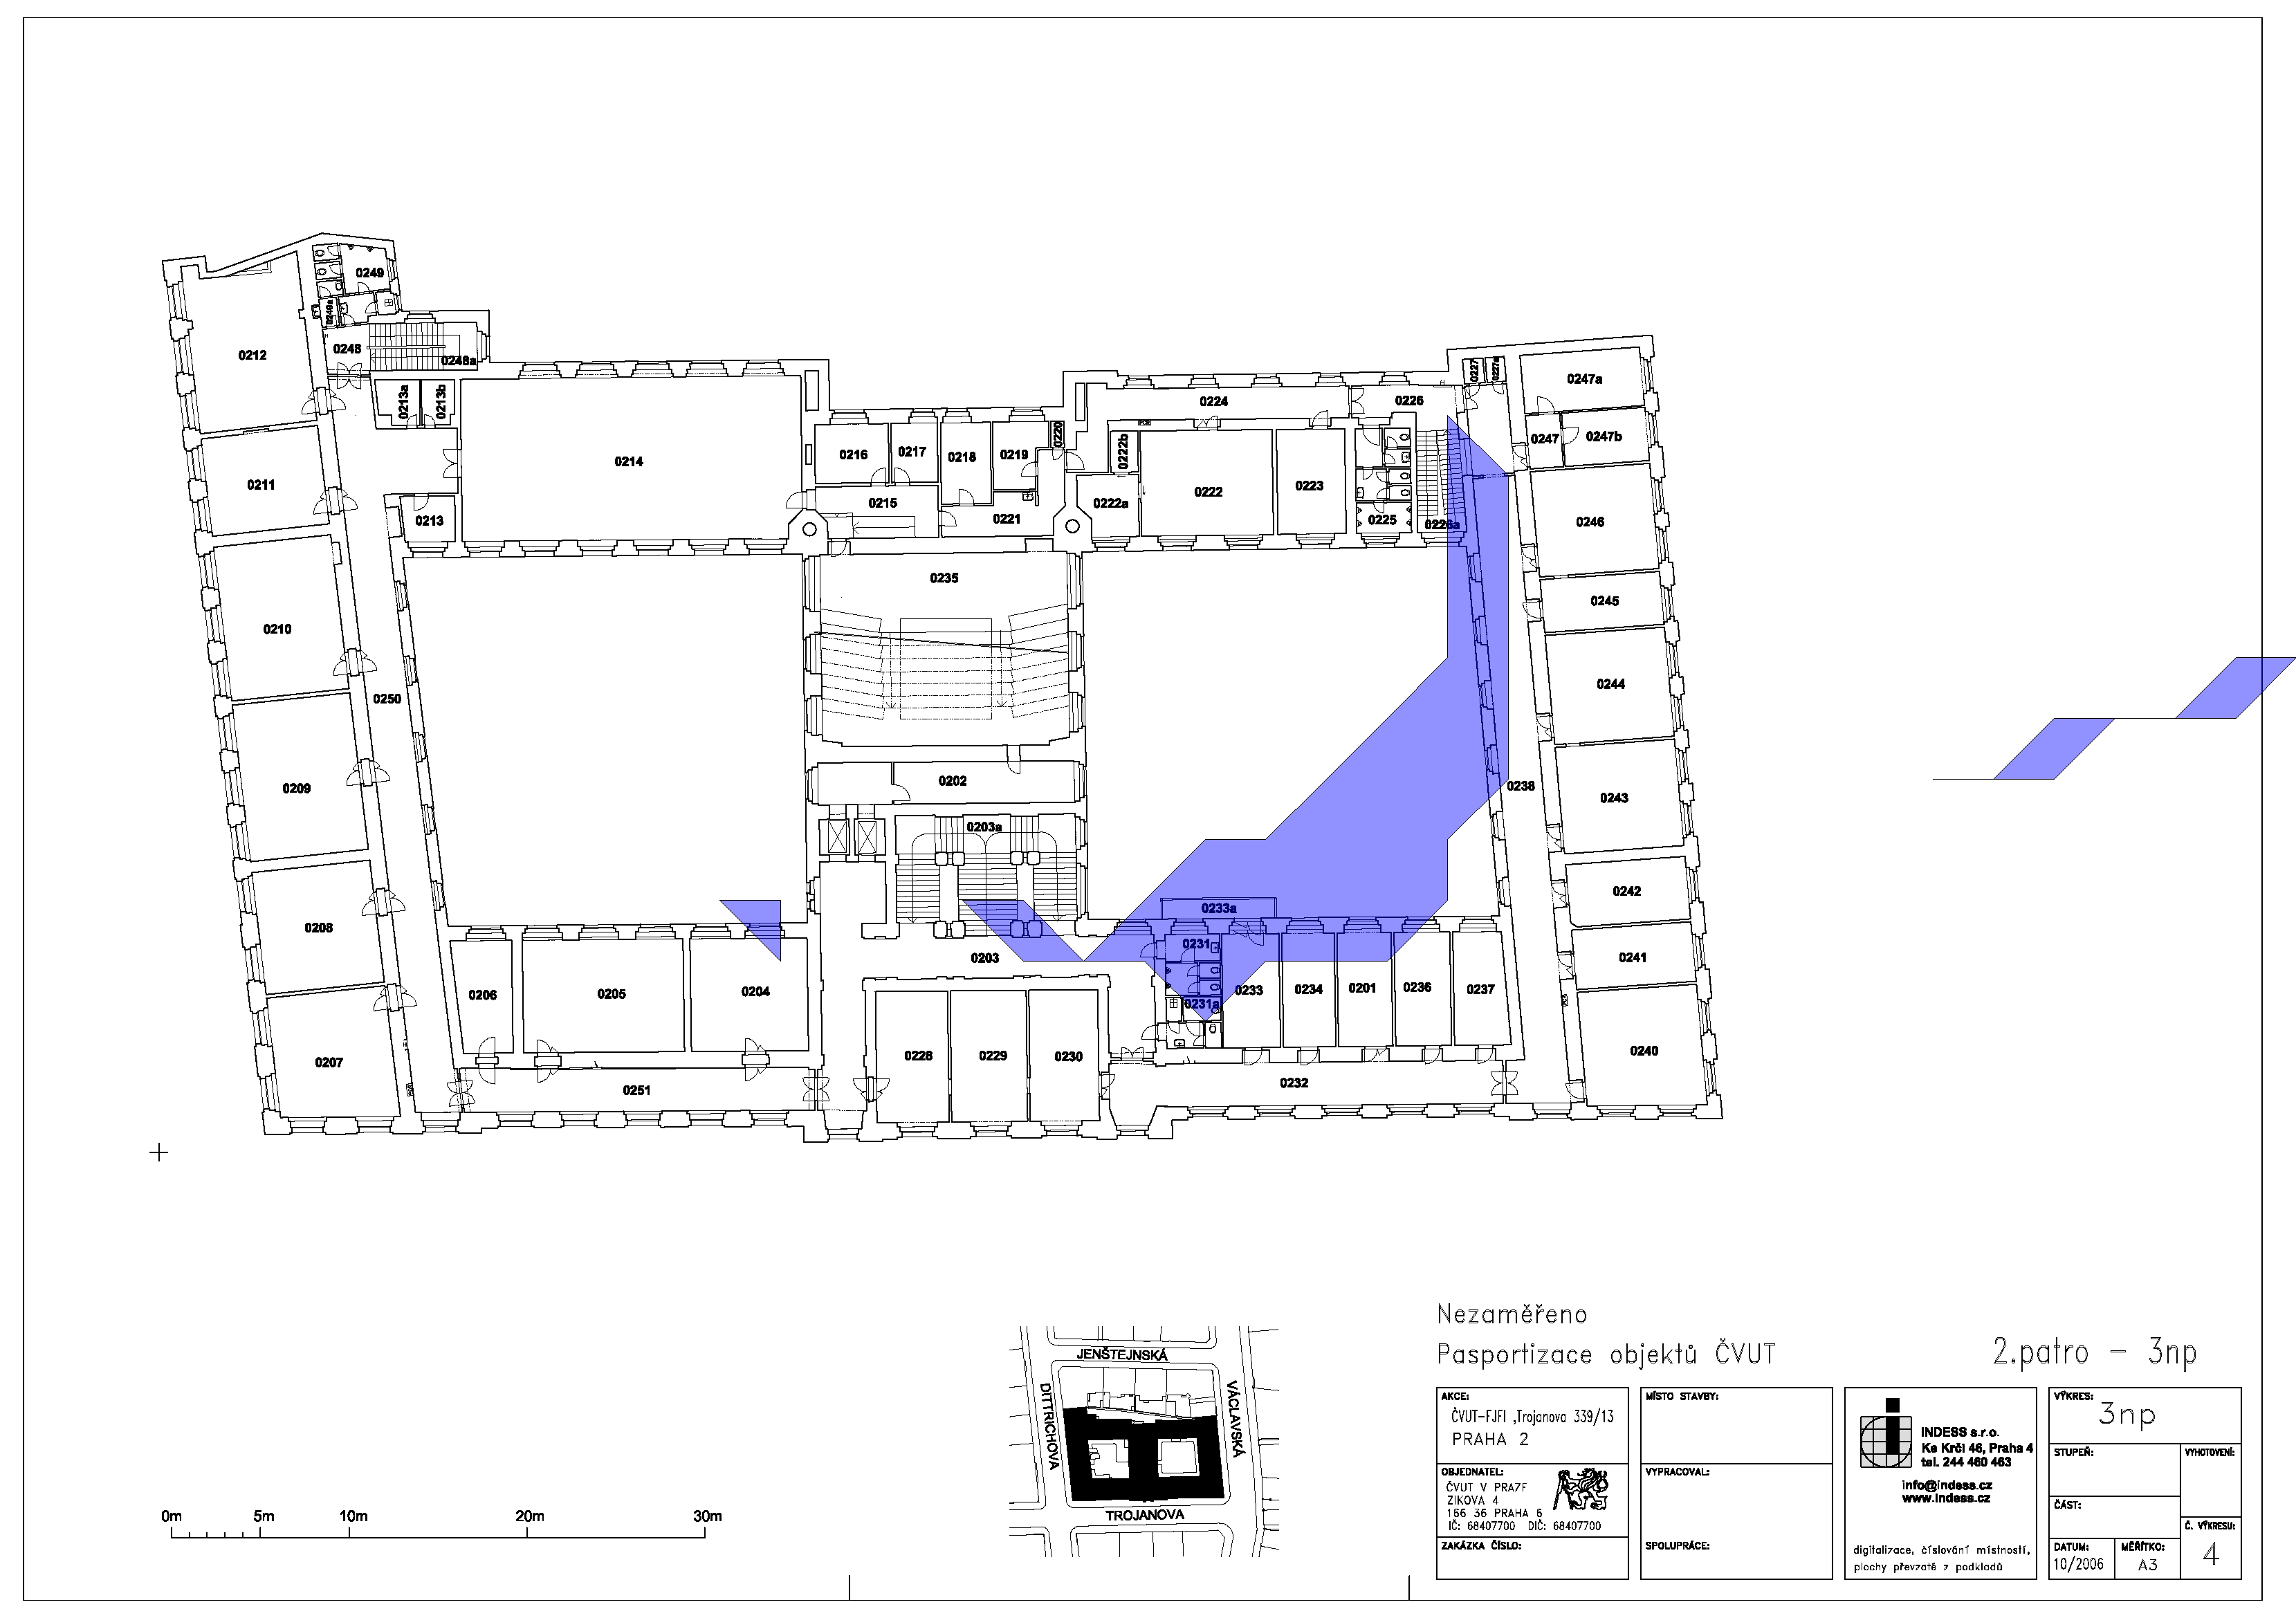
| Site Map | ||
|
||
| ESSID | Name | Band / Channel | Privacy |
|---|---|---|---|
| Simulated Network | 2. patro - AP6 | 802.11g / 6 | |
| Simulated Network | 2. patro - AP3 | 802.11g / 6 | |
| Simulated Network | 2. patro - AP7 | 802.11g / 1 | |
| Simulated Network | 2. patro - AP5 | 802.11g / 6 | |
| Simulated Network | 2. patro - AP4 | 802.11g / 11 | |
| Simulated Network | 2. patro - AP1 | 802.11g / 11 | |
| Simulated Network | 2. patro - AP2 | 802.11g / 1 |
| Name | Transmit Power | Antenna | Height | Direction |
|---|---|---|---|---|
| 2. patro - AP6 | 25 | Omni-directional Antenna (2.15 dBi) | 2.5 | 270 |
| 2. patro - AP3 | 25 | Sector Panel Antenna (10 dBi, 60 degree) | 2.5 | 270 |
| 2. patro - AP7 | 25 | Omni-directional Antenna (2.15 dBi) | 2.5 | 270 |
| 2. patro - AP5 | 25 | Omni-directional Antenna (2.15 dBi) | 2.5 | 270 |
| 2. patro - AP4 | 25 | Omni-directional Antenna (2.15 dBi) | 2.5 | 0 |
| 2. patro - AP1 | 25 | Sector Panel Antenna (10 dBi, 60 degree) | 2.5 | 180 |
| 2. patro - AP2 | 25 | Sector Panel Antenna (10 dBi, 60 degree) | 2.5 | 0 |
| Name | Notes |
|---|---|
| 2. patro - AP6 | |
| 2. patro - AP3 | |
| 2. patro - AP7 | |
| 2. patro - AP5 | |
| 2. patro - AP4 | |
| 2. patro - AP1 | |
| 2. patro - AP2 |
|
|
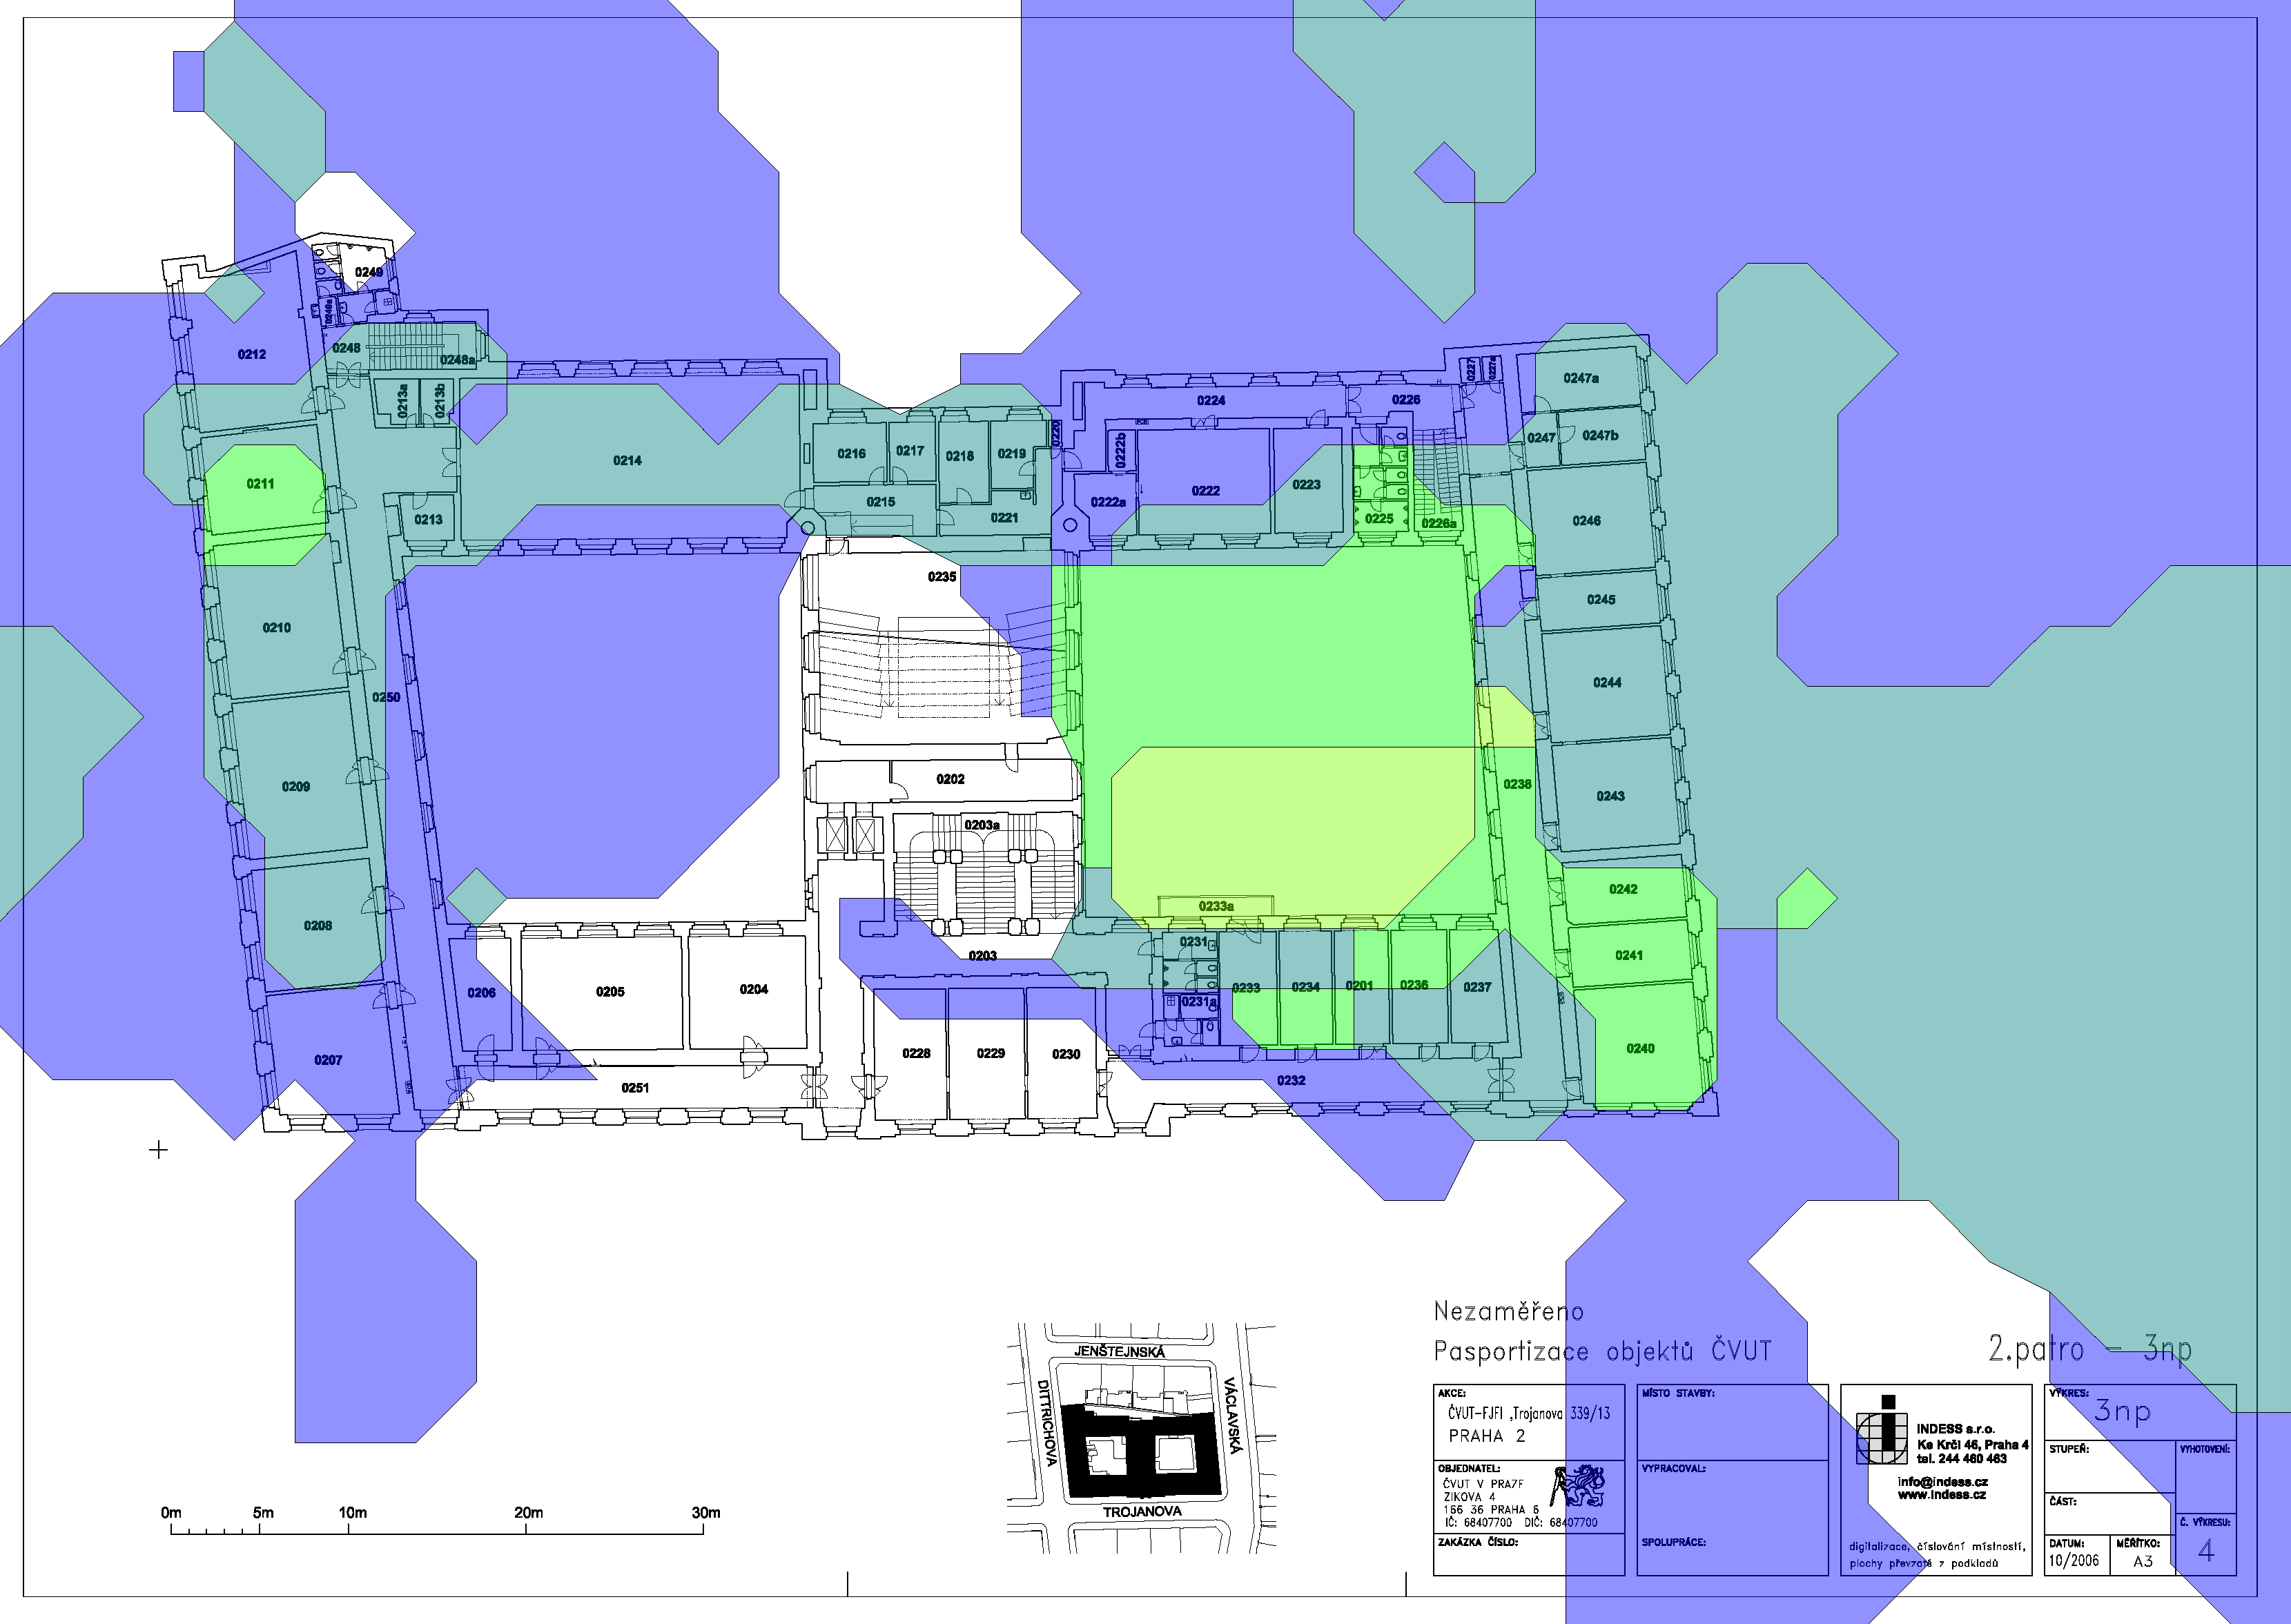
||||||||||||||||||||
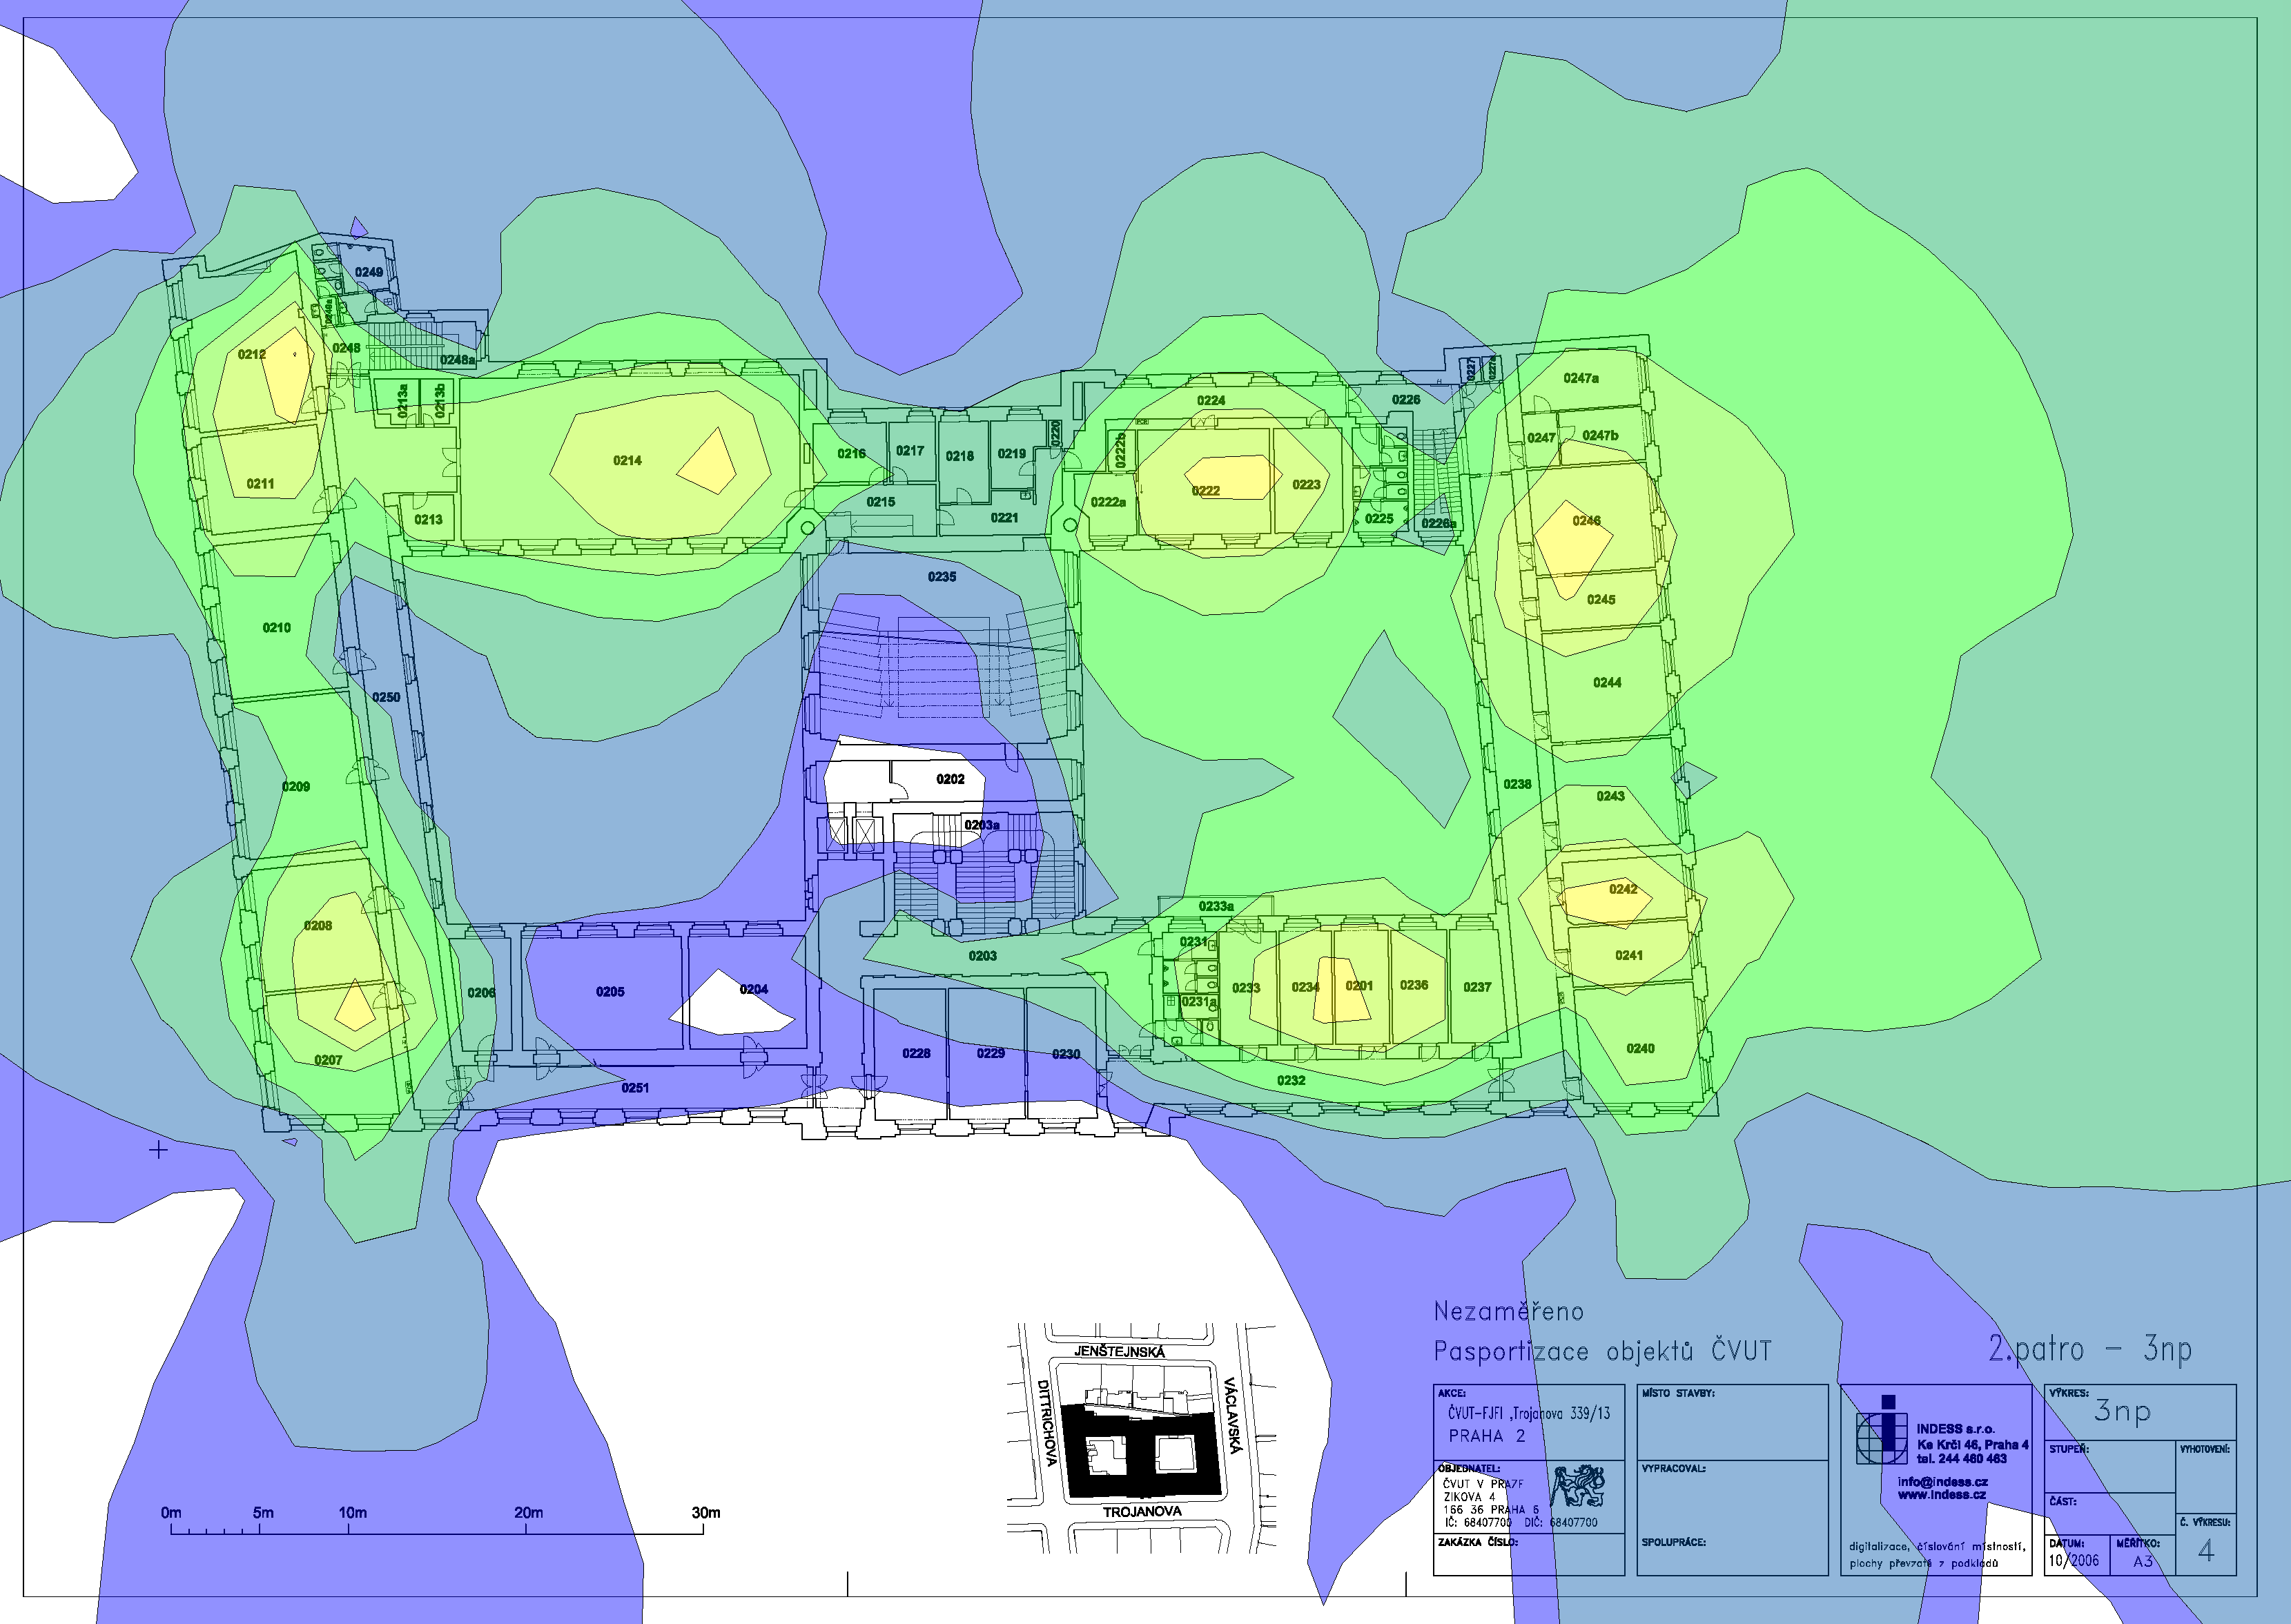
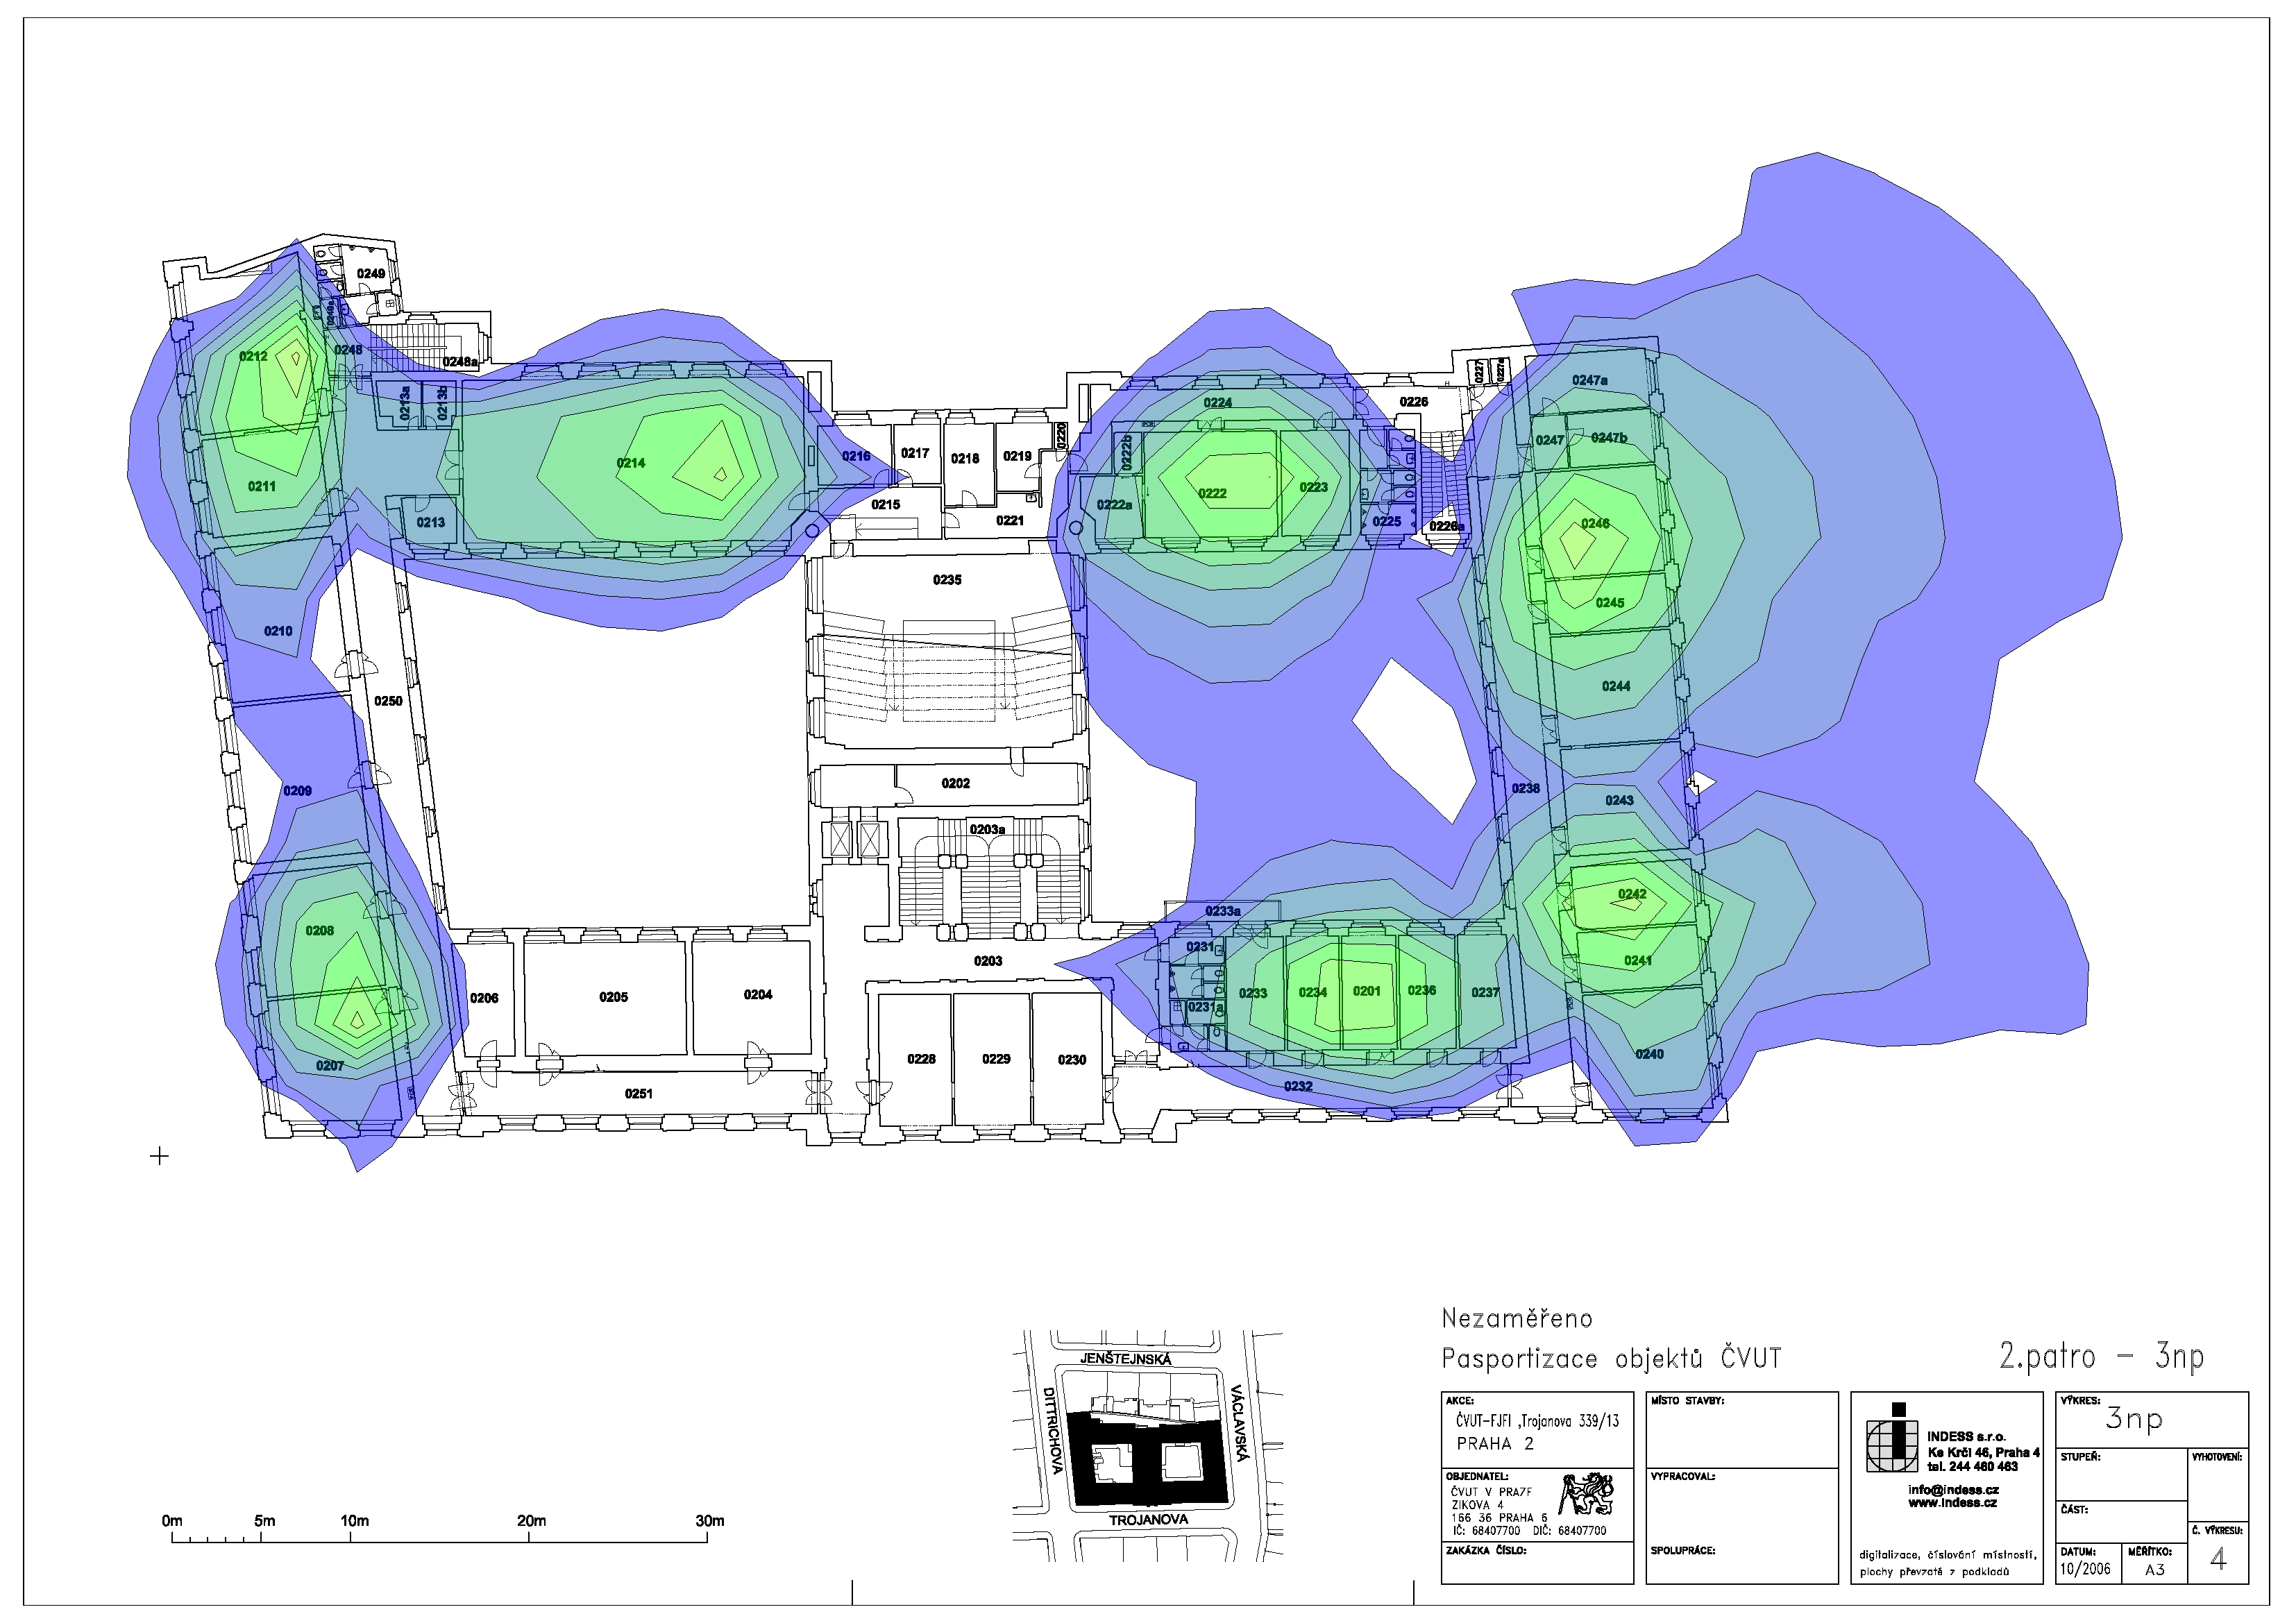
| Signal Strength coverage (RSSI) of the selected access points. The strongest RSSI is shown per location. | ||||||||||||||||||||
|
|
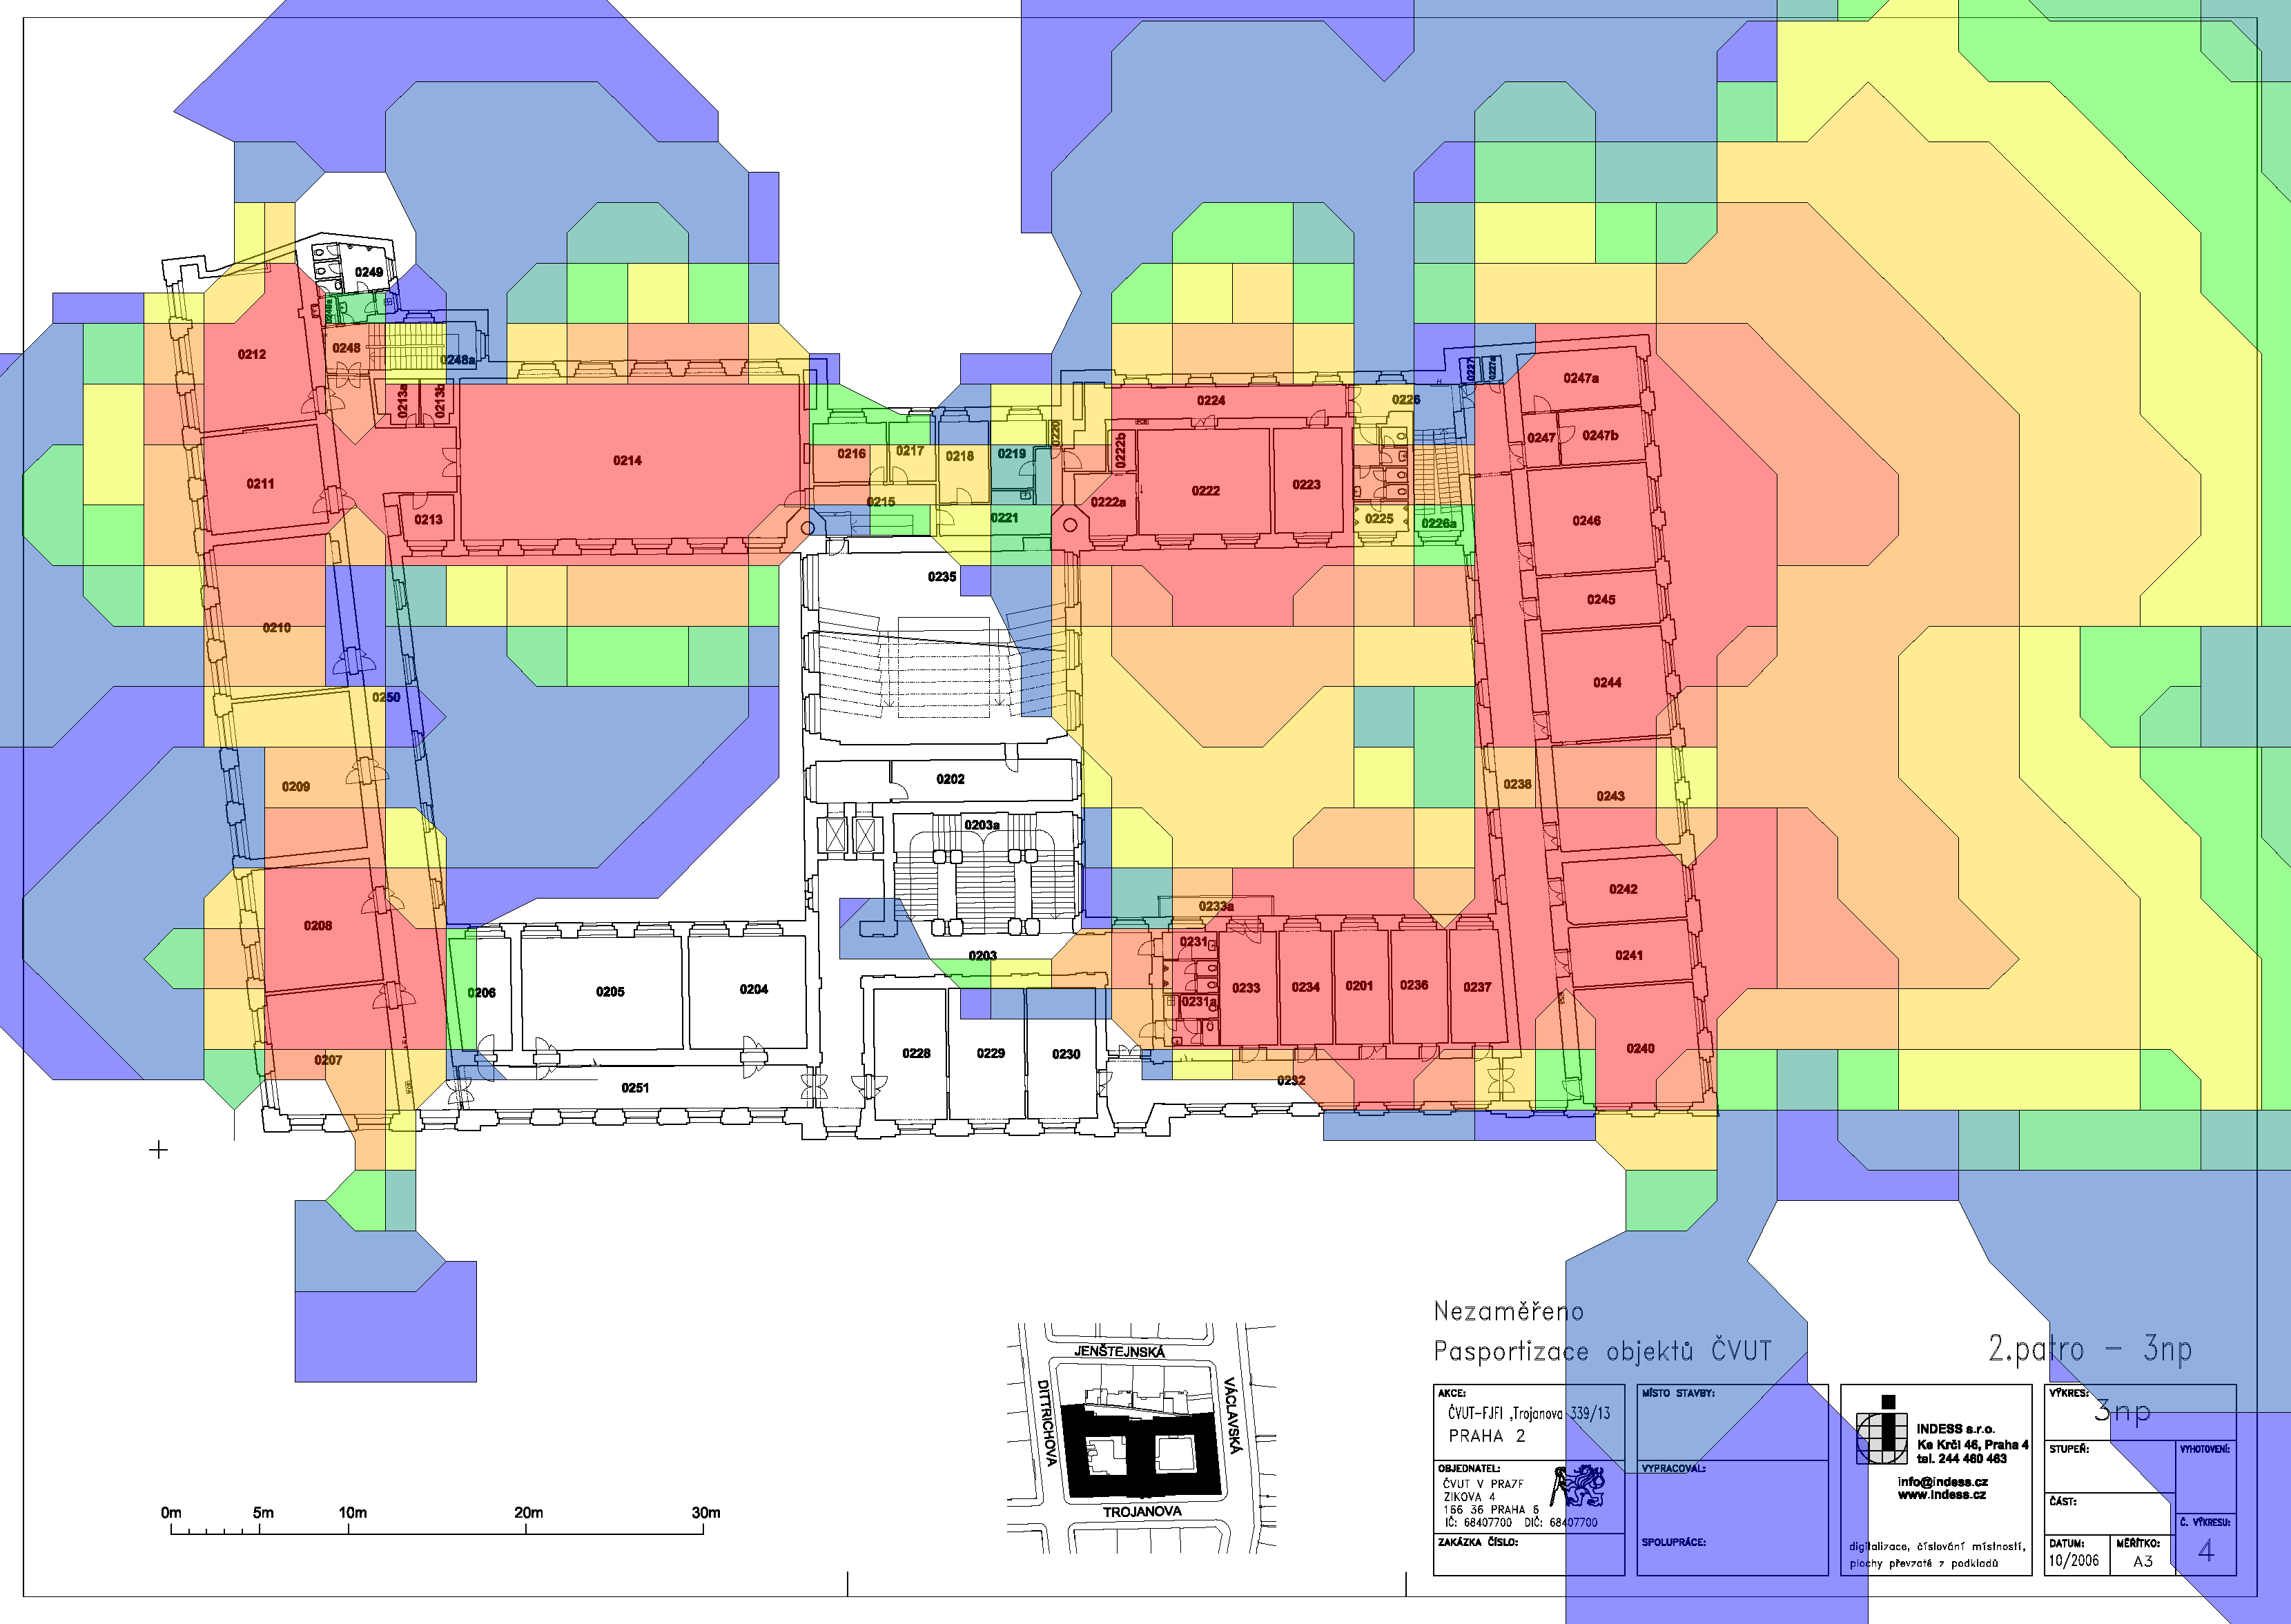
||||||||||||||||||||||||||||||||||||
| Calculated signal to noise ratio. Simplified formula: SNR = [Signal Strength] - [Interference] | ||||||||||||||||||||||||||||||||||||
|
|
||||||||||||||||||||
| Calculated interference | ||||||||||||||||||||
|
|
||||||||||||||
| Displays the number of audible access points per location with respect to the selected minimum RSSI requirement. | ||||||||||||||
|
|
||||||||||||||||||||||||
| An estimate of maximum data rate per location, with respect to the selected Signal-To-Noise threshold and the selected wireless network card receiver sensitivity values | ||||||||||||||||||||||||
|